In this article
The pitch for relocating to a smaller American city usually includes some version of this sentence: at least the housing is affordable. People fleeing Seattle or Boston or the Bay Area have been landing in places like Boise, Chattanooga, and Raleigh for years, running the math on paper and feeling like they’ve beaten the system. The math is getting harder to run.
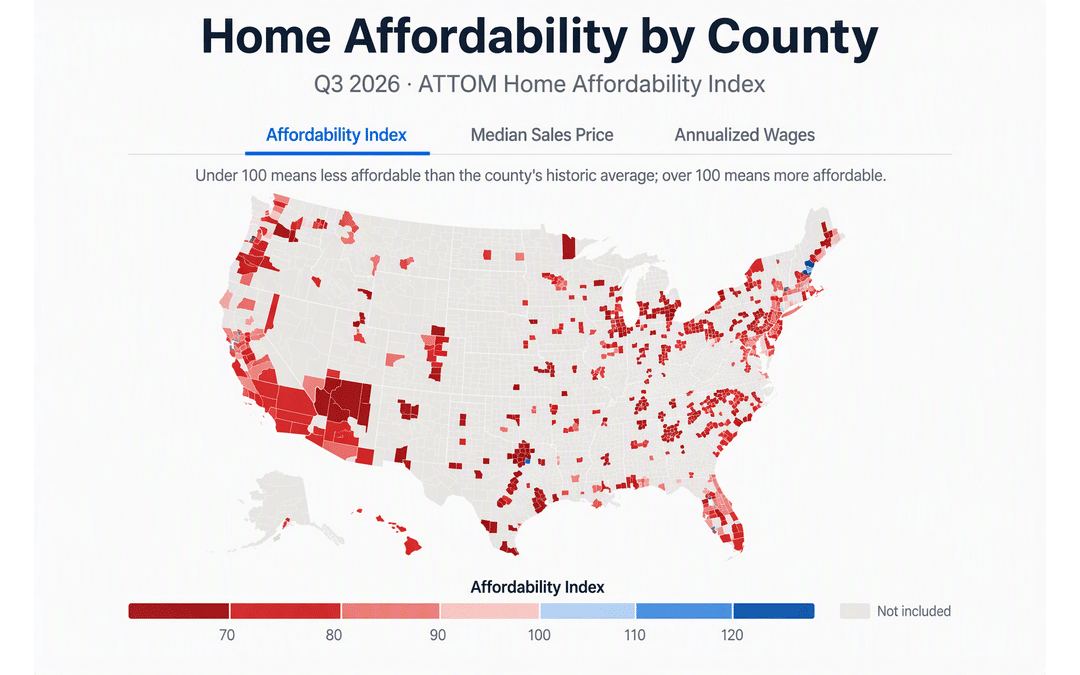
According to ATTOM’s Q3 2026 Home Affordability Report, homes were less affordable than historical averages in 98 percent of counties with sufficient data to analyze. Not expensive relative to coastal markets. Less affordable than their own historical norms. That’s a different and more sobering comparison.
What “Historical Norm” Actually Means Here
ATTOM’s affordability index measures how much of annualized local wages a buyer would need to cover the major expenses of owning a median-priced home - mortgage, insurance, taxes. When the index says a county is below historical norms, it means that residents there are stretching harder to buy today than buyers did in that same market over the past several years, even accounting for local wages.
This matters enormously for anyone relocating with the assumption that they’re moving somewhere prices haven’t lost touch with incomes. In many of the smaller cities that dominate relocation conversations - the ones that appeared on every “most affordable” list between 2018 and 2022 - that assumption is now wrong, or at least complicated.
Rising mortgage rates are a large part of why. A home priced at $280,000 carries a monthly payment that looks nothing like it did when rates were sub-3 percent. The sticker price in mid-size metros may not have spiked the way it did in Austin or Denver, but the carrying cost has.
The Cities That Still Look Relatively Better
Relatively is doing a lot of work in that subheading.
Some markets in the ATTOM data do register higher affordability index scores than others - Anchorage, for example, shows an index of 64.7 against a median sales price of roughly $422,000 and annualized wages around $79,000. That number reflects less strain than many Sun Belt metros, though it’s still below what buyers in Anchorage experienced in earlier years, and the context of living in Anchorage involves variables that don’t appear in any affordability index.
The counties where conditions are least punishing tend to share a few characteristics: wage growth that has kept closer pace with price appreciation, slower in-migration that didn’t compress inventory, and local economies not dominated by sectors that attracted remote workers with coastal salaries. These are often smaller, less-discussed places - not the cities that make the podcast circuit.
What This Means If You’re Planning a Move
If you’re relocating for a job that pays a set salary, the ATTOM data is a reasonable prompt to pressure-test your assumptions before you sign anything. Specifically:
Don’t compare list prices alone. A $350,000 house in a secondary market isn’t automatically more achievable than a $700,000 house in a high-wage metro if your income is also roughly half. The ratio is what matters, and that ratio has deteriorated in most places.
Run the current-rate payment, not the historical one. Online mortgage calculators will use whatever rate you input. Make sure you’re using an actual current rate, not a rate you read about in an article from 2021.
Ask about rent as a viable alternative for the first year. In markets where affordability has compressed recently, renting for twelve months while you understand a city’s actual neighborhood dynamics isn’t a failure of nerve - it’s how you avoid overpaying for a street you haven’t actually lived on yet. A two-bedroom rental in many secondary cities still represents a meaningfully lower monthly commitment than ownership at today’s rates.
Check wage trajectory alongside price trajectory. Some markets show median sales prices up year-over-year while wages have grown only modestly. Others show the reverse. ATTOM publishes this data at the county level; the annualized wage figures are worth looking at alongside the price numbers rather than treating price alone as the indicator.
The Uncomfortable Part
The 98-percent figure suggests this isn’t a problem with a clean geographic solution. There is no obvious list of places where the old logic - move somewhere cheaper and your dollars go further - still operates cleanly. Some places are better than others. The spread is real. But the floor has risen.
For people relocating in the next six to eighteen months, that means the decision calculus has to account for more than home prices. Commute patterns, rental stock quality, the timeline to purchase, job market depth if things go sideways - these aren’t secondary considerations anymore.
Somewhere in Midland County, Texas, an ATTOM affordability index score sits in a spreadsheet that almost nobody looking at Zillow listings will ever read.